

Glowing fiber optic cables connecting server racks in a dark data center with visualized data packet flow
Network Packet Analysis Guide

Every second, millions of data packets race across enterprise networks carrying emails, video streams, database queries, and authentication tokens. When performance degrades or security incidents occur, IT teams need visibility into this traffic at the most granular level. Network packet analysis provides that microscopic view, revealing exactly what's happening on the wire.
Unlike high-level monitoring dashboards that show bandwidth graphs or connection counts, packet analysis examines the raw data units traversing your infrastructure. This capability transforms vague complaints like "the application is slow" into actionable findings: duplicate TCP retransmissions caused by a misconfigured switch, DNS queries timing out due to firewall rules, or suspicious encrypted traffic patterns indicating data exfiltration.
What Is Network Packet Analysis?
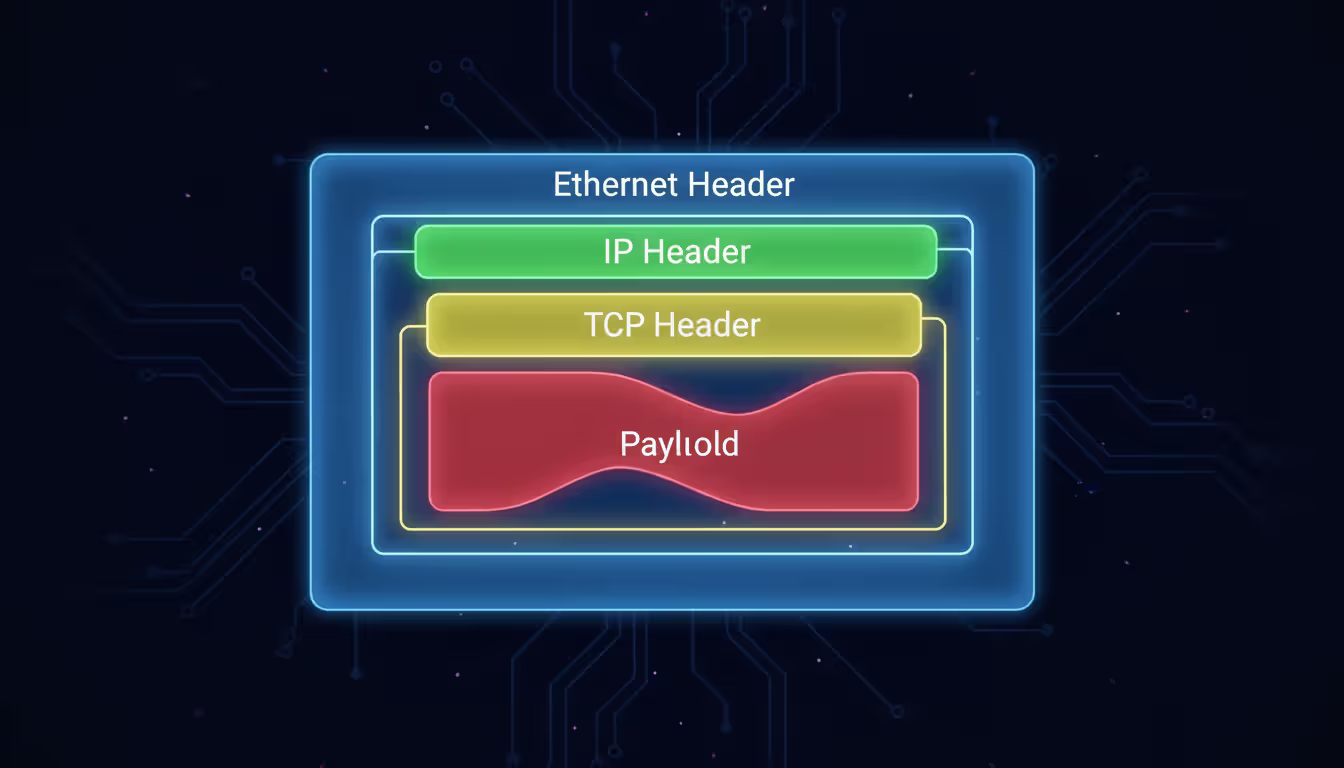
Network packet analysis is the process of capturing, decoding, and examining individual data packets as they travel across a network. A packet represents the fundamental unit of data transmission—a discrete chunk containing both the actual payload (your email text, a fragment of a video file, a database record) and multiple headers that describe routing, error-checking, and protocol information.
Each packet typically includes several nested headers. An HTTP request, for example, carries an Ethernet header (Layer 2 addressing), an IP header (Layer 3 source and destination), a TCP header (Layer 4 port numbers and sequencing), and finally the HTTP header and payload. Analyzing these layers reveals not just what data moved, but how it moved, which path it took, how long each hop delayed it, and whether any errors occurred in transit.
IT and security teams rely on this analysis for several reasons. Performance engineers pinpoint latency sources by measuring time deltas between SYN and ACK packets. Security analysts detect command-and-control traffic by spotting unusual DNS query patterns or certificate anomalies in TLS handshakes. Compliance officers verify that sensitive data never leaves designated network segments. Network architects validate QoS policies by confirming DSCP markings match expected values.
The technique differs fundamentally from flow analysis tools like NetFlow or IPFIX, which aggregate connection metadata into summaries. Flow records tell you that Host A sent 47 MB to Host B over 200 connections in the past hour. Packet analysis shows you the exact HTTP 403 error message Host B returned, the cipher suite negotiated during the TLS handshake, and the 147-millisecond delay before the application layer responded.
How Network Packet Analysis Works
The analysis workflow follows four distinct phases, each requiring different technical capabilities and domain knowledge.
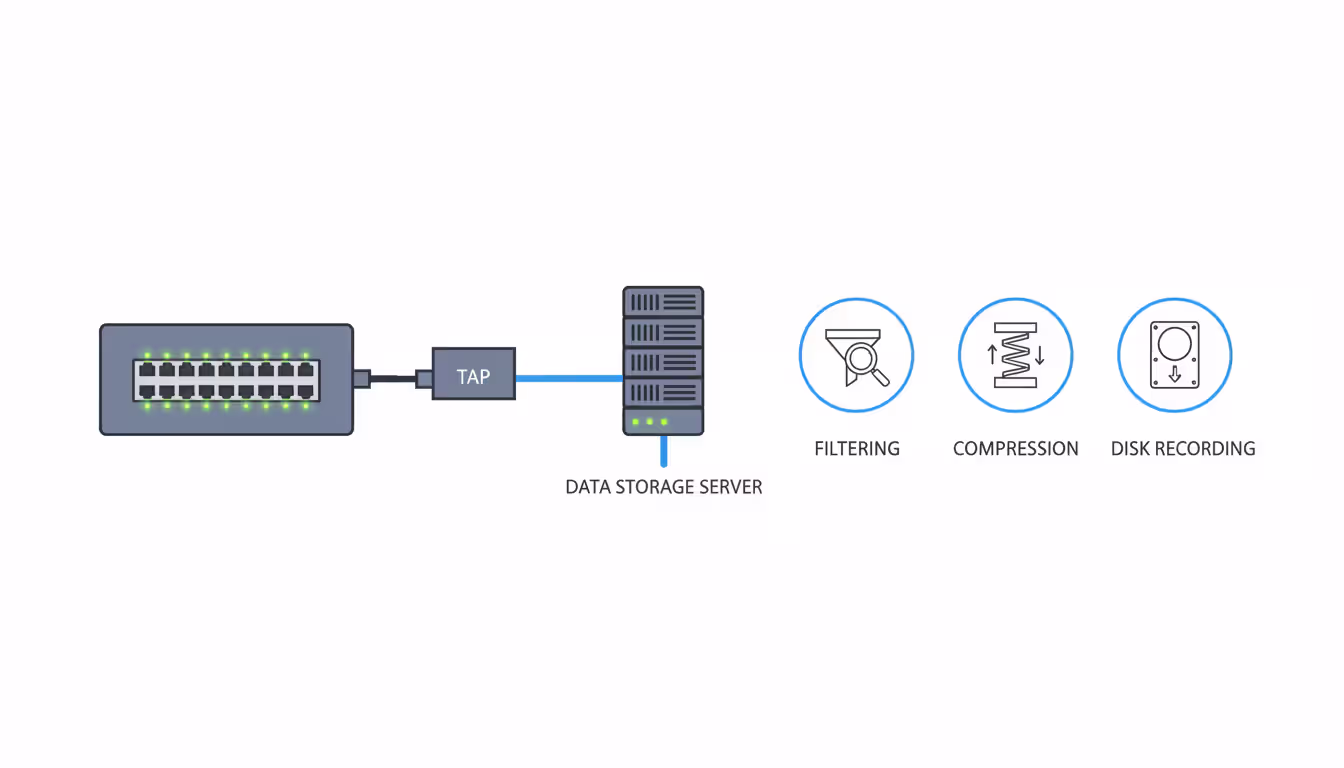
Capture begins with placing a sensor at a strategic network location—typically a SPAN port on a switch, a network TAP (test access point), or directly on a host's network interface. The sensor copies packets without interfering with live traffic. Capture scope matters: monitoring a server's uplink captures all traffic to that system, while a core switch SPAN port might see aggregated traffic from hundreds of VLANs. Engineers must balance visibility against data volume; capturing full payloads on a 10 Gbps link generates terabytes daily.
Author: Derek Hollowell;
Source: clatsopcountygensoc.com
Decode translates raw binary data into human-readable protocol structures. A decoder recognizes that bytes 12-13 in an Ethernet frame indicate the EtherType (0x0800 for IPv4), then parses the subsequent IP header, extracts the protocol field (6 for TCP), and continues decoding nested protocols. Modern decoders handle thousands of protocols—from common standards like HTTP/2 and DNS to proprietary industrial control protocols. Without accurate decoding, analysts see hexadecimal dumps instead of meaningful field names and values.
Inspect applies filters and search criteria to isolate relevant packets from potentially millions captured. An analyst investigating slow database queries might filter for packets matching the database server IP, TCP port 3306 (MySQL), and containing specific query strings in the payload. Inspection also includes reassembling TCP streams to reconstruct complete conversations, following packet sequences across retransmissions and out-of-order delivery.
Interpret requires domain expertise to understand what the decoded, filtered packets actually mean. Seeing a TCP window size drop to zero explains why throughput collapsed—the receiving application stopped reading data, forcing the sender to pause. Observing repeated ARP requests for a gateway IP suggests a Layer 2 connectivity issue. Spotting TLS alerts during handshakes points to certificate validation failures. Interpretation transforms technical packet details into operational conclusions and remediation steps.
The protocols analyzed most frequently include TCP/IP (connection establishment, retransmissions, window scaling), HTTP/HTTPS (request methods, response codes, header manipulation), DNS (query types, response times, cache behavior), and TLS (cipher negotiation, certificate chains, session resumption). Each protocol has characteristic patterns that indicate normal operation versus problems. DNS queries should resolve in under 50 milliseconds; longer delays suggest recursive resolver issues. TCP three-way handshakes completing in under 10 milliseconds indicate local communication, while 200-millisecond handshakes point to WAN latency.
Tools Used for Capturing and Analyzing Packets
The packet analysis ecosystem includes software applications, hardware appliances, and infrastructure components, each optimized for different scales and use cases.
Software packet sniffers run on standard servers or workstations, using the operating system's packet capture libraries (libpcap on Linux/Unix, Npcap on Windows). These tools excel at targeted troubleshooting and forensic analysis. An engineer can install a sniffer on a laptop, connect to a problem segment, capture for ten minutes, then analyze offline. Software solutions typically cost less and offer flexibility—the same tool works in the data center, branch office, or cloud environment.
Hardware appliances provide dedicated processing power for high-throughput environments. A 100 Gbps network generates packet rates exceeding what general-purpose CPUs can process without dropping packets. Purpose-built appliances use FPGAs or specialized ASICs to handle line-rate capture, apply hardware-accelerated filters, and write directly to high-speed storage arrays. These systems cost significantly more but guarantee zero packet loss during capture, which matters for compliance requirements or security investigations where missing even 0.1% of packets could hide critical evidence.
Network Packet Sniffers vs. Analyzers
The terms "sniffer" and "analyzer" are often used interchangeably, but technically describe different functional emphases.
A network packet sniffer focuses on the capture phase. Its primary job is reliably copying packets from the wire into memory or storage. Sniffers typically offer basic filtering (capture only traffic matching certain IPs or ports) and simple statistics (packet counts, bandwidth utilization). Think of a sniffer as a high-fidelity recording device—it preserves everything accurately but doesn't necessarily help you understand what you recorded.
A network packet analyzer emphasizes the decode and interpret phases. Analyzers include sophisticated protocol decoders, reconstruction engines that reassemble fragmented packets or TCP streams, visualization tools that graph latency or sequence numbers over time, and expert systems that automatically flag anomalies. Many modern tools combine both functions—they capture packets and provide rich analysis capabilities—but the distinction matters when evaluating specialized tools. A lightweight sniffer might run on an embedded device with limited CPU, capturing packets for later analysis on a more powerful system.
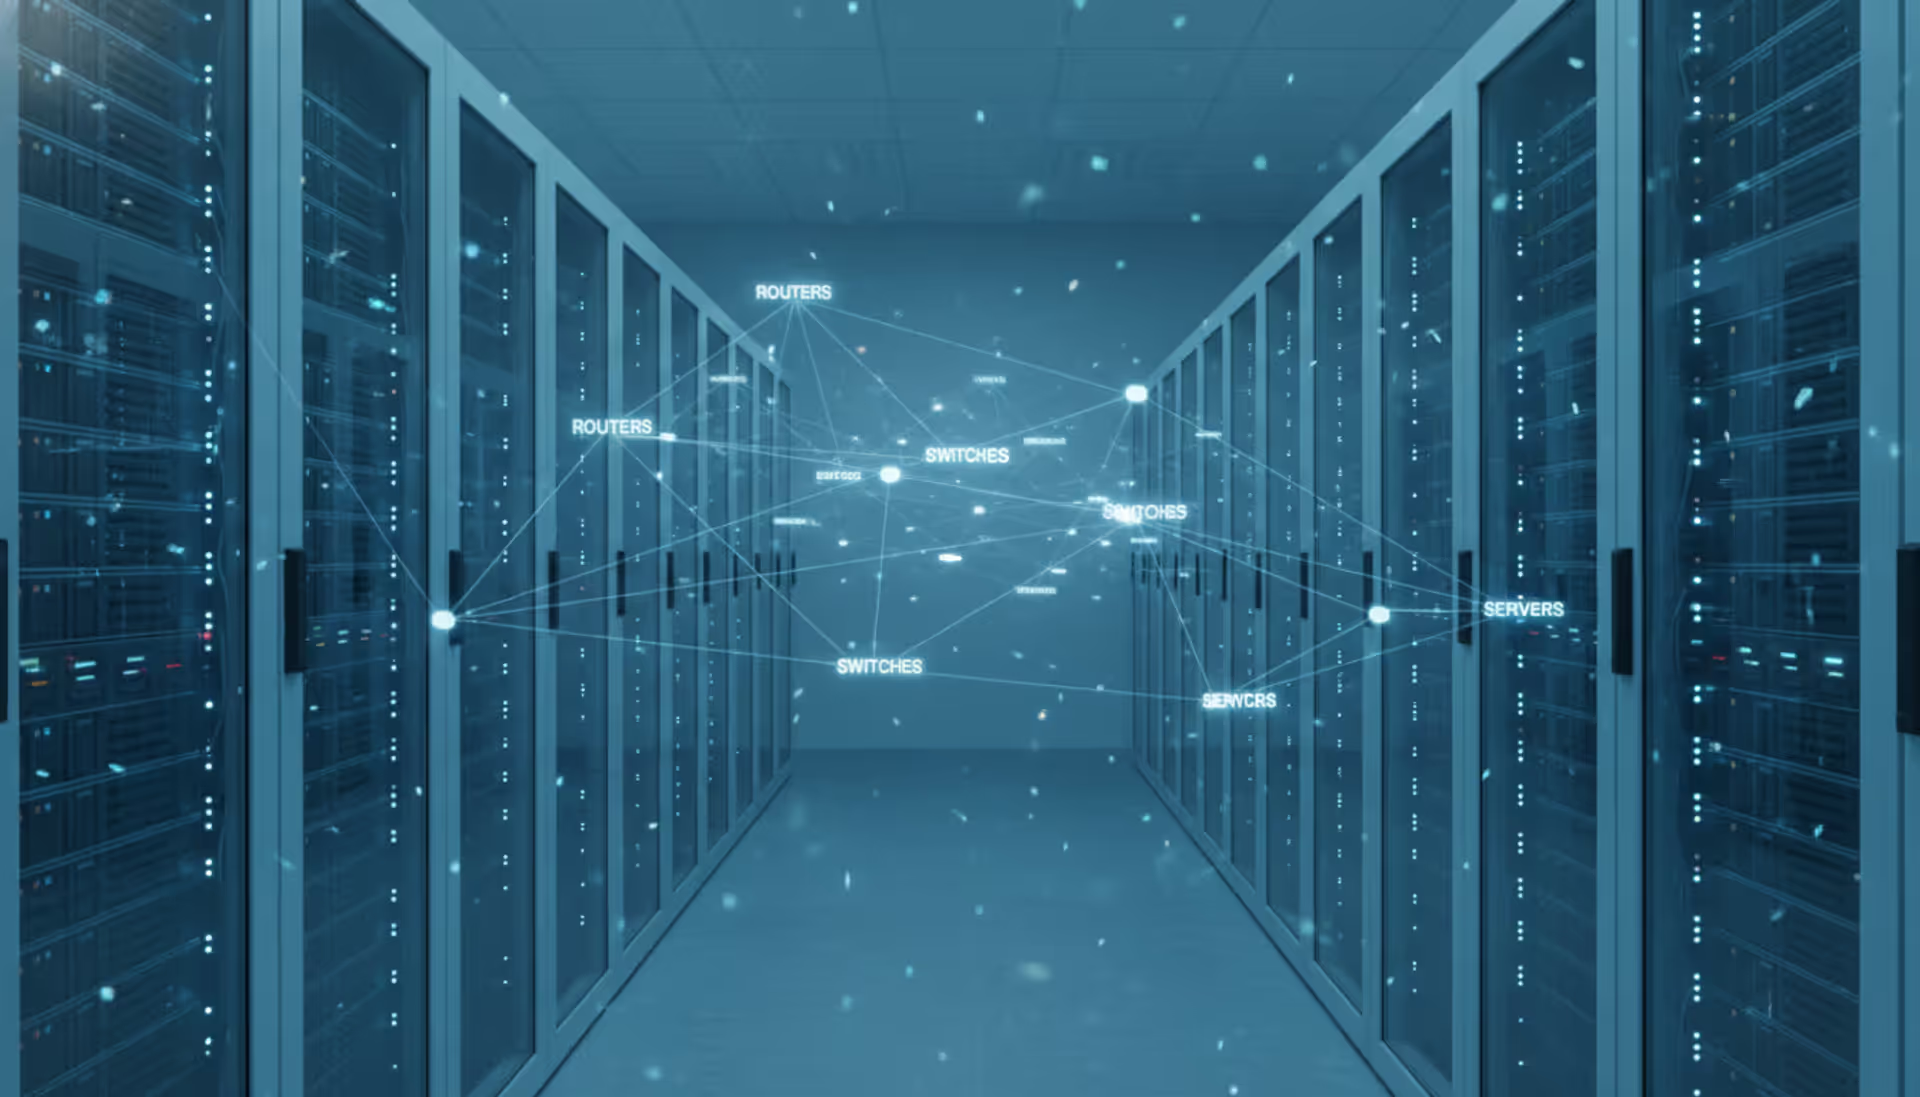
Role of Network Packet Brokers
As networks scale beyond a few hundred endpoints, a new challenge emerges: efficiently distributing packet copies to multiple analysis tools without overloading SPAN ports or creating monitoring blind spots.
A network packet broker sits between network TAPs or SPAN ports and your analysis tools, acting as an intelligent traffic director. The broker aggregates packet streams from multiple network links, applies filtering and deduplication, then distributes optimized traffic to specific tools based on their needs.
For example, your security information and event management (SIEM) system might only need DNS and HTTP traffic, while your application performance monitoring tool requires complete TCP conversations for specific application servers. Without a broker, you'd need separate SPAN ports for each tool, quickly exhausting switch resources. The broker receives all traffic once, then selectively forwards relevant subsets to each tool.
Brokers also solve port speed mismatches. A 40 Gbps core link can't directly feed a tool with only 10 Gbps interfaces—the broker aggregates multiple 10 Gbps outputs or filters traffic to fit within the tool's capacity. Advanced brokers provide SSL decryption, inserting themselves into TLS sessions to provide plaintext traffic for analysis (with appropriate security controls), packet slicing (capturing only headers to reduce storage), and timestamping for precise latency measurements.
Small networks with a single monitoring tool rarely need a broker—direct SPAN to tool works fine. But once you deploy multiple security and performance tools, or scale beyond 10 Gbps links, a broker becomes essential infrastructure.
| Tool Type | Primary Function | Typical Use Case | Examples |
| Packet Sniffer | Capture and store network traffic with basic filtering | Short-term troubleshooting, evidence collection, spot-checking specific issues | tcpdump, dumpcap, Windump |
| Packet Analyzer | Deep protocol decode, stream reconstruction, anomaly detection, visualization | Root cause analysis, security investigation, protocol validation, capacity planning | Wireshark, tshark, NetworkMiner |
| Packet Broker | Aggregate, filter, and distribute traffic to multiple monitoring tools | Large-scale monitoring infrastructure, tool optimization, visibility architecture | Gigamon, Ixia Vision, cPacket |
Common Use Cases for Network Packet Monitoring
Organizations implement network packet analysis to solve specific operational challenges that higher-level monitoring tools can't address.
Troubleshooting performance degradation represents the most frequent use case. Users report that a web application "feels slow," but server logs show normal response times. Packet capture reveals the truth: the application responds in 50 milliseconds, but DNS lookups take 8 seconds due to a misconfigured resolver. Or TCP window scaling is disabled on a firewall, limiting throughput to 5 Mbps on a gigabit link. Or a load balancer is resetting connections every 60 seconds, forcing applications to re-authenticate constantly. These issues are invisible to application logs and server metrics but obvious in packet traces.

Author: Derek Hollowell;
Source: clatsopcountygensoc.com
Detecting security threats requires visibility into actual network conversations, not just connection summaries. Analysts hunt for indicators of compromise: DNS queries to newly registered domains associated with malware campaigns, TLS certificates with suspicious subject names, HTTP user-agent strings indicating automated scanning tools, or unusual protocol usage like IRC on non-standard ports. A compromised endpoint might generate only 10 KB of traffic per hour to its command-and-control server—too little to trigger bandwidth alerts, but clearly visible as periodic HTTPS POSTs to an IP address with no reverse DNS entry.
Compliance auditing often mandates proof that sensitive data never traverses unauthorized network segments. Packet captures provide that proof. An auditor asks, "Can you demonstrate that credit card numbers never leave the payment processing VLAN?" A week of continuous capture filtered for patterns matching card numbers (regex for 16-digit sequences) across all other VLANs, showing zero matches, provides definitive evidence. Healthcare organizations use similar techniques to verify Protected Health Information (PHI) stays within HIPAA-compliant zones.
Bandwidth analysis moves beyond "how much" to "what kind." NetFlow reports that 60% of WAN bandwidth goes to "HTTPS traffic," but that's not actionable. Packet analysis, even with encrypted traffic, reveals more: 45% is video streaming (identified by packet sizes, timing patterns, and destination IPs matching content delivery networks), 10% is cloud backup (large sustained transfers to known backup service IPs), and only 5% is actual business-critical SaaS applications. Armed with this breakdown, network teams can implement QoS policies that prioritize business apps without blindly throttling all HTTPS.
Application development and API testing benefits from packet-level visibility into how applications actually communicate versus how developers think they communicate. An API might specify JSON payloads under 1 KB, but packet traces reveal the client sends 50 KB requests including redundant nested objects, causing performance problems. Or an application claims to implement HTTP keep-alive, but traces show it opens a new TCP connection for every request, wasting time on repeated TLS handshakes.
Choosing the Right Network Packet Analyzer
Selecting an appropriate tool requires matching technical capabilities to your specific environment and objectives.
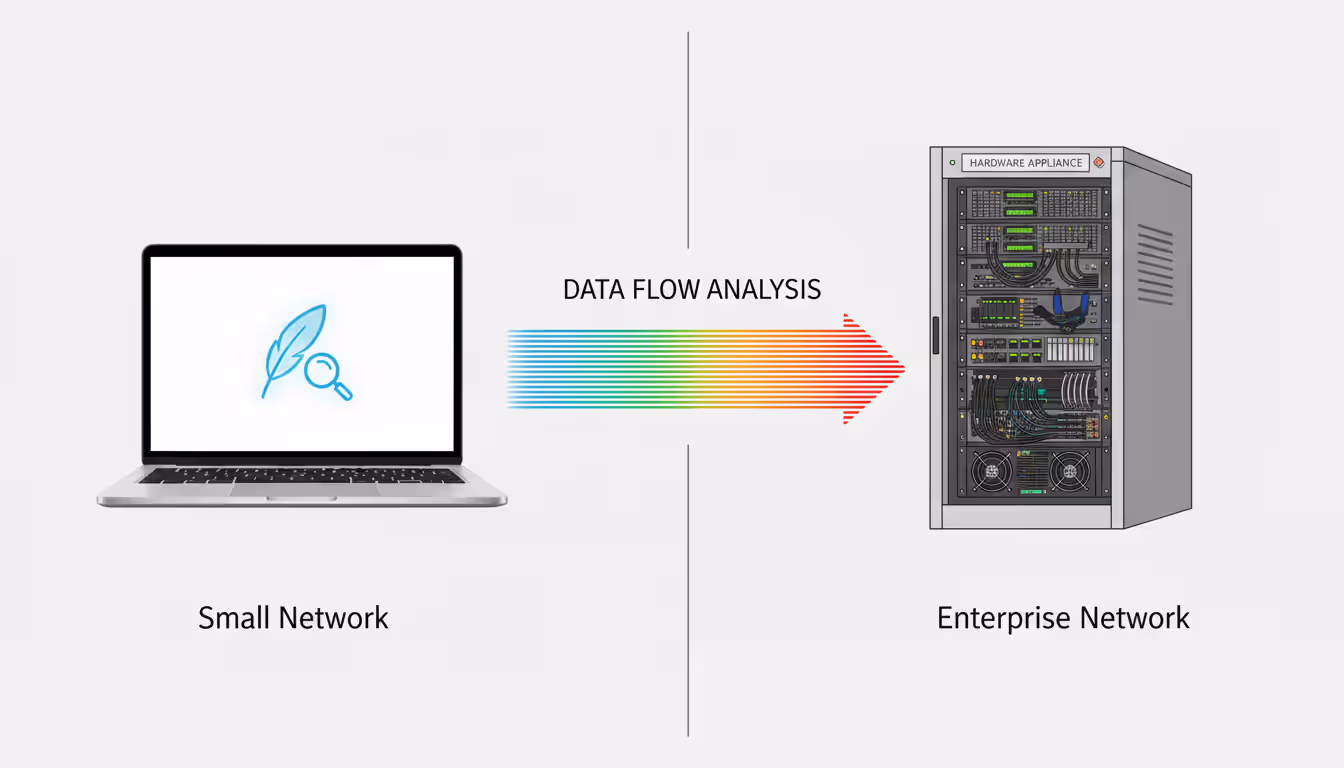
Environment size and traffic volume determine whether software or hardware solutions fit. A small business with 50 employees and a 1 Gbps internet connection can use free software tools on a desktop PC. An enterprise with 10,000 users and multiple 100 Gbps data center links needs purpose-built appliances with terabyte-scale storage and hardware acceleration. Underestimating scale leads to dropped packets, which undermines the entire analysis—you can't trust conclusions drawn from incomplete data.
Protocol support matters if you work with specialized applications. General-purpose analyzers decode hundreds of common protocols but might not understand proprietary database replication protocols, industrial control systems like Modbus or DNP3, or emerging protocols like QUIC. Check whether the tool includes decoders for your specific protocols or allows custom decoder plugins. Without proper decoding, you're stuck analyzing hexadecimal dumps, dramatically increasing analysis time.
Author: Derek Hollowell;
Source: clatsopcountygensoc.com
Real-time versus forensic analysis represents different operational modes. Real-time analysis processes packets as they arrive, providing immediate alerts when anomalies occur—essential for security operations centers monitoring for active threats. Forensic analysis works with stored packet captures, allowing detailed investigation hours or days after an incident. Some tools excel at one mode but not both. A real-time security appliance might retain only 15 minutes of raw packets before overwriting, insufficient for investigating an incident discovered a week later. A forensic tool might take 20 minutes to load and index a large capture file, too slow for real-time alerting.
Budget constraints force trade-offs. Open-source tools like Wireshark and tcpdump cost nothing but require significant expertise and offer no vendor support. Commercial tools range from $5,000 for single-user licenses to $500,000+ for enterprise platforms with distributed sensors and centralized management. Consider total cost of ownership: a "free" tool that requires 40 hours of engineer time per month for maintenance and analysis might cost more than a commercial tool that automates common tasks and provides faster time-to-resolution.
Ease of use and learning curve impact how quickly teams can become productive. Wireshark offers unmatched depth but presents a steep learning curve—new users often feel overwhelmed by thousands of packets scrolling past. Commercial tools with guided workflows, automated root cause analysis, and pre-built filters for common scenarios let junior engineers contribute sooner. However, simplified interfaces sometimes hide important details that expert analysts need. The best approach often combines tools: junior staff use simplified commercial tools for routine issues, escalating complex problems to senior engineers with advanced tools.
Best Practices for Network Packet Capture
Effective packet analysis begins with proper capture techniques. Poor capture practices lead to incomplete data, legal problems, or storage exhaustion.
Capture filters reduce data volume by excluding irrelevant traffic before it's written to disk. Instead of capturing everything on a busy server and generating 500 GB daily, apply a filter for only the problematic application's ports: "tcp port 8443 or tcp port 3306." This reduces capture size by 95% while preserving relevant data. However, overly aggressive filtering risks excluding important context. If you filter for only HTTP traffic but the root cause involves DNS resolution failures, you'll miss the problem. Start with broader filters, then narrow based on initial findings.
Storage considerations require planning for worst-case scenarios. Full packet capture on a 10 Gbps link at 50% utilization generates approximately 5.4 TB per day. Even with compression (typically 3:1 for mixed traffic), you need 1.8 TB daily storage. Retention requirements vary: troubleshooting might need only hours of data, security investigations might require weeks, and compliance mandates might specify months. Many organizations implement tiered storage: keep full packets for 7 days on fast SSD storage, then retain only packet headers (10% of the size) for 90 days on cheaper spinning disks.
Author: Derek Hollowell;
Source: clatsopcountygensoc.com
Privacy and legal concerns demand clear policies before capturing. In most jurisdictions, organizations can capture traffic on their own networks, but laws vary regarding employee notification, union agreements, and cross-border data transfers. Capturing traffic containing personal information might trigger GDPR requirements if European citizens are involved. Healthcare and financial organizations face additional regulations. Establish written policies covering what gets captured, who can access captures, how long they're retained, and under what circumstances they're shared with third parties. Train analysts to avoid unnecessarily viewing sensitive content—just because you can reconstruct someone's webmail session doesn't mean you should.
Avoiding packet loss requires attention to the entire capture pipeline. Packet loss can occur at the network TAP (if it's oversubscribed), the capture interface (if the NIC driver's buffer fills), the capture application (if it can't write to disk fast enough), or the storage system (if write IOPS are exhausted). Monitor capture statistics continuously—tools report dropped packets, and even 0.5% loss can hide critical evidence. Use dedicated capture interfaces separate from management networks, disable unnecessary protocol processing (IPv6 if you're only capturing IPv4), and write to local fast storage rather than network-mounted filesystems. For high-throughput environments, consider multi-threaded capture tools that distribute processing across CPU cores.
Capture duration and timing require strategic thinking. Intermittent problems demand longer captures—a connection timeout that occurs once per hour requires at least two hours of capture to observe twice and confirm the pattern. But performance issues often correlate with business cycles: an application that slows every morning at 9 AM requires captures during that specific window, not overnight when the network is idle. Use triggered captures that start automatically when certain conditions occur (CPU exceeds 80%, response time crosses a threshold) rather than continuous capture that wastes storage on normal operation.
Packet-level visibility remains the ground truth for network operations. When every other monitoring system disagrees about what's happening, packet captures reveal exactly what crossed the wire. The investment in capture infrastructure and analyst training pays for itself the first time you resolve a critical outage in 20 minutes instead of 20 hours
— Marcus Chen
Frequently Asked Questions
Network packet analysis transforms network troubleshooting and security investigation from guesswork into evidence-based problem solving. By examining individual packets—their headers, payloads, timing, and sequencing—IT teams pinpoint root causes that remain invisible to higher-level monitoring tools.
The discipline requires both appropriate tooling and developed expertise. Software sniffers suffice for small-scale troubleshooting, while enterprise environments demand purpose-built appliances and packet brokers to handle multi-gigabit traffic without data loss. Choosing tools means matching protocol support, analysis capabilities, and budget to your specific operational requirements.
Success depends equally on technique: strategic capture point selection, effective filtering to manage data volumes, proper storage planning for retention requirements, and careful attention to privacy regulations. Organizations that invest in packet analysis capabilities—both technology and trained personnel—gain a decisive advantage when diagnosing complex performance issues, investigating security incidents, or validating compliance controls.
The networks supporting business operations in 2026 are faster, more complex, and more critical than ever. When problems occur, packet analysis provides the microscopic visibility needed to understand exactly what happened and how to fix it. That capability transforms reactive firefighting into proactive network management, reducing downtime, improving security posture, and ultimately supporting business objectives through reliable, performant infrastructure.
Related Stories
Read more

Read more


The content on this website is provided for general informational and educational purposes related to cloud computing, network infrastructure, and IT solutions. It is not intended to constitute professional technical, engineering, or consulting advice.
All information, tools, and explanations presented on this website are for general reference only. Network environments, system configurations, and business requirements may vary, and results may differ depending on specific use cases and infrastructure.
This website is not responsible for any errors or omissions, or for actions taken based on the information, tools, or technical recommendations presented.