

Modern data center with server racks illuminated by blue and purple neon lights, holographic performance monitoring dashboards floating in the foreground showing graphs and status indicators
How to Monitor Virtual Machine Performance and Health?

Virtual machines power most enterprise workloads, but their invisible resource sharing and layered architecture make performance problems harder to diagnose than bare-metal servers. A VM that ran smoothly yesterday can grind to a halt today because a neighbor consumed shared storage bandwidth, or a hypervisor update changed CPU scheduling behavior. Effective monitoring cuts through these layers to pinpoint bottlenecks before users notice slowdowns.
What Is Virtual Machine Monitoring
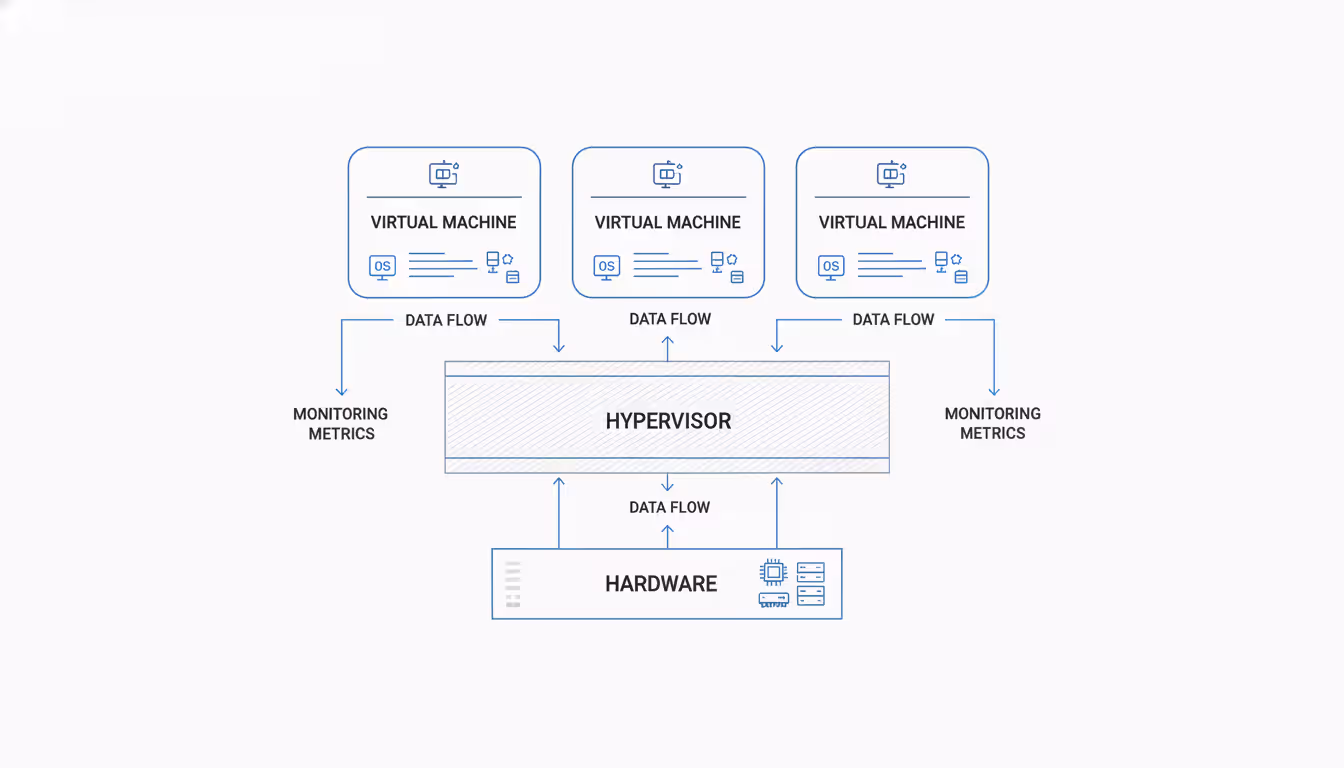
Virtual machine monitoring tracks resource consumption, availability, and performance across virtualized infrastructure. Unlike physical server monitoring that reads directly from hardware sensors, VM monitoring collects metrics from multiple abstraction layers—the guest operating system, the hypervisor managing resource allocation, and the underlying physical hardware.
The hypervisor introduces complexity that physical monitoring never encounters. When ten VMs share one physical CPU, each VM's performance depends not just on its own workload but on what the other nine are doing. A monitoring system that only checks CPU utilization inside the guest OS might report 40% usage while the VM actually waits in the hypervisor's scheduling queue 60% of the time. This "ready time" metric exists only in virtualized environments.
Cloud environments add another dimension. With virtual machine cloud deployments, you lose visibility into physical hardware entirely. AWS doesn't tell you which specific server hosts your EC2 instance or when it moves to different hardware during maintenance. Your monitoring must work within the abstraction the cloud provider exposes—usually guest-level metrics plus whatever the provider's API offers about instance state and basic resource consumption.
On-premises virtualization gives deeper visibility. VMware vCenter shows you memory ballooning, CPU ready time, storage latency at the datastore level, and exactly how overcommitted your hosts are. You control the monitoring agents, the data retention, and the correlation between physical and virtual layers. The trade-off is that you're responsible for maintaining this monitoring infrastructure.
Author: Adrian Keller;
Source: clatsopcountygensoc.com
Key Metrics for Virtual Machine Performance Monitoring
CPU utilization means different things depending on where you measure it. Inside the guest OS, 80% CPU usage might look concerning. At the hypervisor level, that same VM might show 15% ready time—meaning it spent 15% of the measurement period waiting for physical CPU cycles. The guest thinks it's busy; the hypervisor knows it's starved.
Memory monitoring gets even trickier. A Windows VM reporting 90% memory usage might be perfectly healthy—Windows caches aggressively. But if the hypervisor shows active memory ballooning, the host is reclaiming RAM from that VM because physical memory ran short. The guest OS doesn't know this is happening until performance degrades. Swapping compounds the problem: guest OS swap to virtual disk, which might be backed by SAN storage already overloaded with I/O from other VMs.
Disk I/O metrics need context. 200 IOPS might saturate a VM on spinning disks but barely register on NVMe storage. Latency matters more than throughput for most workloads. When average read latency climbs from 5ms to 50ms, users notice application slowdowns even if total IOPS stayed constant. Watch for sudden latency spikes during backup windows or when storage snapshots run—these often indicate storage array contention affecting multiple VMs simultaneously.
Network utilization rarely hits physical limits, but packet loss and retransmits signal problems. A VM pushing 800 Mbps on a 1 Gbps virtual NIC isn't constrained by bandwidth—check for dropped packets instead. Virtual switches can introduce latency that physical networks don't have, especially when security policies inspect every packet or when network overlays add encapsulation overhead.
| Metric | What It Measures | Healthy Range | Warning Signs |
| CPU Ready Time | Time VM waits for physical CPU | < 5% average | > 10% sustained indicates host overcommitment |
| Memory Ballooning | RAM reclaimed by hypervisor | 0 MB | Any ballooning suggests host memory pressure |
| Disk Latency | Storage response time | < 10ms read/write | > 20ms average impacts application performance |
| Network Packet Loss | Dropped packets | 0% | > 0.1% causes TCP retransmits and slowdowns |
| CPU Co-Stop | Wait time for multi-vCPU scheduling | < 3% | High values mean VM has more vCPUs than needed |
| Storage Queue Depth | Pending I/O operations | < 4 average | Sustained high queues indicate storage bottleneck |
Guest OS metrics show what the application sees; hypervisor metrics reveal what's actually happening. Monitor both. A database reporting slow query times might blame CPU inside the guest, but the hypervisor shows storage latency spiked because another VM started a backup job to the same datastore.
Resource contention appears in subtle ways. CPU overlap—when multiple VMs need CPU simultaneously—causes scheduling delays that don't show up as high CPU usage. Storage contention manifests as increased latency rather than maxed-out throughput. Network contention might appear as increased retransmits before bandwidth limits are reached. These second-order effects require monitoring tools that understand virtualization-specific metrics.
Virtual Machine Monitoring Tools and Platforms
VMware vCenter provides comprehensive monitoring for vSphere environments, tracking everything from CPU ready time to storage path failures. The performance charts show real-time and historical data, but the interface wasn't designed for monitoring hundreds of VMs simultaneously. You'll spend time clicking through folders and tabs to find the VM with the problem. vRealize Operations adds analytics and capacity planning but requires separate licensing and infrastructure.
Microsoft System Center monitors Hyper-V environments with similar depth. It integrates with Active Directory and other Microsoft infrastructure naturally, but cross-platform monitoring requires additional tools. Hyper-V Manager gives basic performance data sufficient for small deployments, but enterprises need System Center's automation and alerting capabilities.
Author: Adrian Keller;
Source: clatsopcountygensoc.com
Third-party tools like Datadog, New Relic, and Prometheus with Grafana work across hypervisors and cloud providers. They typically use agents installed in the guest OS, collecting application-level metrics alongside infrastructure data. This approach provides consistent monitoring whether your VMs run on VMware, Hyper-V, or virtual machine cloud computing platforms like AWS and Azure. The trade-off is that agent-based monitoring consumes resources on every VM and requires keeping agents updated.
Cloud-native monitoring varies by provider. AWS CloudWatch monitors EC2 instances with basic metrics included and detailed monitoring available for additional cost. Azure Monitor integrates with Azure VMs and can collect custom metrics through agents. Google Cloud Monitoring provides similar capabilities. None of these tools see hypervisor-level metrics—cloud providers don't expose that layer. You're monitoring the virtual machine cloud from inside the guest OS and through whatever the cloud API provides about instance state and basic resource consumption.
SIEM integration matters for security and compliance. Shipping VM logs to Splunk, Elastic, or similar platforms lets you correlate performance events with security incidents. When a VM's CPU spikes at 3 AM, SIEM logs might show a failed login attempt preceded it, revealing a brute-force attack rather than a legitimate workload.
Agentless monitoring uses hypervisor APIs to collect metrics without installing software in each VM. This reduces overhead and works for VMs you can't modify, but you lose application-level visibility. You'll see that CPU is high but not which process caused it. Hybrid approaches use agentless monitoring for infrastructure metrics and lightweight agents for application-specific data.
Monitoring During Virtual Machine Migration
Establishing a performance baseline before virtual machine migration gives you a reference point for post-migration validation. Collect at least one week of metrics covering business cycles—weekday peaks, weekend lows, batch job windows. Note CPU usage patterns, memory consumption trends, disk I/O profiles, and network traffic volumes. Document any existing performance issues so you don't attribute pre-existing problems to the migration.
Live migration monitoring requires real-time visibility into both source and destination environments. Watch memory transfer rates—slow network links extend migration windows and increase the risk of failure. Track application response times during the migration; most live migration technologies briefly pause the VM during final state transfer, causing a few seconds of unresponsiveness. If that pause exceeds five seconds, investigate network bandwidth or storage performance constraints.

Author: Adrian Keller;
Source: clatsopcountygensoc.com
Storage migration often causes more disruption than compute migration. Moving a VM's virtual disks between datastores generates heavy I/O on both source and destination storage. Monitor storage latency on both arrays and watch for impact on other VMs sharing those datastores. Schedule storage migrations during maintenance windows or use throttling to limit I/O impact, accepting longer migration times to preserve production performance.
Post-migration validation should compare actual performance against your baseline. CPU usage might differ if the destination hardware has different processor generations or clock speeds. Memory performance rarely changes unless the destination has NUMA configuration issues. Storage performance can vary significantly between arrays or between on-premises SAN and cloud block storage. Network latency might increase when migrating to virtual machine cloud environments in different regions.
Common migration performance problems include CPU feature mismatches causing unexpected overhead, storage provisioning differences (thick vs. thin disks), and network configuration errors like MTU mismatches. A VM migrated from 10 Gbps on-premises networking to 1 Gbps cloud networking will hit bandwidth limits it never encountered before. Watch for applications that timeout or retry operations they previously completed successfully.
Security Monitoring and Virtual Machine Firewall Integration
Network traffic monitoring at the virtual switch level sees everything before virtual machine firewall rules filter it. This visibility reveals port scans, connection attempts to unexpected services, and unusual traffic patterns that might indicate compromised VMs. Virtual switches can mirror traffic to analysis tools without impacting VM performance, unlike physical tap configurations.
Firewall rule effectiveness tracking identifies rules that never match traffic (dead rules cluttering the configuration) and rules that match unexpectedly high volumes (potential policy errors or attacks). When a rule blocking outbound SMTP suddenly logs thousands of matches, investigate whether a VM is compromised and attempting to send spam. Rules that never match in six months probably aren't needed.
Anomaly detection compares current behavior against historical patterns. A database server that never initiated outbound connections suddenly connecting to external IPs warrants investigation. A web server receiving traffic on non-HTTP ports might be running an unauthorized service or suffering a scanning attack. Baseline normal behavior for each VM, then alert on deviations.
East-west traffic between VMs often bypasses traditional perimeter security. Micro-segmentation with per-VM firewall rules limits lateral movement after a breach, but only if you monitor compliance. Verify that firewall rules are applied to every VM and that no VMs run in "promiscuous mode" seeing all virtual network traffic. Automated compliance scanning catches configuration drift before it creates security gaps.
Log aggregation is mandatory for forensics and compliance. Individual VM firewall logs scattered across hundreds of instances are useless during incident response. Centralize logs to a SIEM or log management platform, correlating firewall events with authentication logs, application logs, and system events. When investigating a breach, you need to reconstruct the attack timeline across multiple VMs and security layers.
Reactive monitoring tells you what broke. Proactive monitoring tells you what's about to break. The difference is whether you're explaining an outage to executives or preventing one they never knew was coming. In virtualized infrastructure, where resource contention can cascade across dozens of VMs in minutes, proactive monitoring isn't optional—it's the only way to maintain SLAs
— Marcus Chen
Common Virtual Machine Monitoring Challenges
Alert fatigue kills monitoring programs. When engineers receive 200 alerts daily, they ignore them or disable notifications entirely. Then the one critical alert drowns in noise nobody's reading. Tune thresholds based on actual impact rather than arbitrary percentages. CPU at 90% might be normal for a batch processing VM but catastrophic for a latency-sensitive application server. Context-aware alerting reduces false positives.
Multi-cloud visibility requires stitching together metrics from AWS CloudWatch, Azure Monitor, Google Cloud Monitoring, and on-premises tools. Each platform uses different metric names, collection intervals, and APIs. Third-party tools promise unified dashboards, but you'll still need platform-specific knowledge to interpret what you're seeing. An "unhealthy" instance in AWS means something different than an "unhealthy" VM in vCenter.
Monitoring agent overhead becomes significant at scale. An agent consuming 2% CPU and 100 MB RAM per VM seems negligible until you're running 1,000 VMs—that's 20 physical CPU cores and 100 GB RAM dedicated to monitoring. Agent updates require coordination across the entire VM fleet. A buggy agent update can impact every VM simultaneously, turning your monitoring system into an outage cause.

Author: Adrian Keller;
Source: clatsopcountygensoc.com
Scaling monitoring across thousands of VMs requires architectural planning. Time-series databases storing millions of metrics need proper sizing and retention policies. Dashboards that work for 50 VMs become unusable at 500 VMs—you need aggregation, filtering, and search capabilities. Alert routing must handle different teams responsible for different VM groups, with escalation paths that don't wake everyone for every issue.
Data retention costs add up quickly. Storing one-minute granularity metrics for 1,000 VMs over 90 days generates terabytes of data. Balance retention requirements against storage costs by using tiered retention: one-minute granularity for seven days, five-minute for 30 days, hourly for one year. Aggregate and downsample old data rather than deleting it entirely—long-term trends reveal capacity planning needs.
FAQ
Virtual machine monitoring succeeds when it reveals problems before users experience them and provides enough detail to fix issues quickly. The layers of abstraction in virtualized infrastructure—guest OS, hypervisor, physical hardware, and cloud APIs—require monitoring at multiple levels to understand what's actually happening. A comprehensive monitoring strategy combines guest-level application metrics with hypervisor resource data, correlates events across these layers, and presents actionable information to the teams responsible for maintaining performance.
The specific tools matter less than the approach: establish baselines, monitor deviations, alert on impact rather than arbitrary thresholds, and continuously tune based on what you learn. Whether you're managing a dozen VMs on-premises or thousands across multiple cloud providers, the fundamentals remain the same—measure what matters, ignore what doesn't, and make the data accessible to people who can act on it.
Related Stories

Read more

Read more


The content on this website is provided for general informational and educational purposes related to cloud computing, network infrastructure, and IT solutions. It is not intended to constitute professional technical, engineering, or consulting advice.
All information, tools, and explanations presented on this website are for general reference only. Network environments, system configurations, and business requirements may vary, and results may differ depending on specific use cases and infrastructure.
This website is not responsible for any errors or omissions, or for actions taken based on the information, tools, or technical recommendations presented.